
Fixed Income and Rates
Filed in: Fixed Income | Rates | Duration | Convexity | Yield Curve | Bootstrapping | Banking | Finance
Fixed Income and Rates
This article is an introduction to Fixed Income instruments. I only want to give here a basic walk through.
Bonds
A Bond is essentially an IOU or interest bearing debt. This would be for example a government that wants to build a large infrastructure project would raise finance by selling Bonds on the open Market. You buy the bond giving the government money and in return the bond will pay you a coupon on an annual or semi-annual basis and at the maturity of the bond you get back your principal. So for example you can have a 5% fixed coupon paying annually with a Maturity of 5 years with a principal of $100. This means that every year you get 5% of 100 representing the coupons and then in 5 years time you get $100. This means that all together you get 5 coupon payments (C1 to C5) and 1 principal payment ( P ) over the 5 year life.
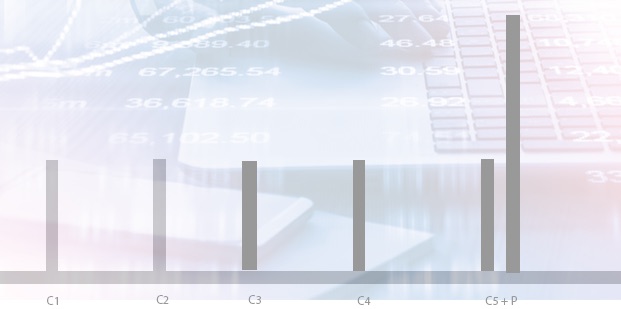
As you can see your returns come at different points in time. This implies that the value must be related to the time value of money meaning the use of Forward value. We will come onto the value of each of the coupons in a little bit.
Corporate Bonds
Corporates can issue bonds as well however you should realise that corporates that issue bonds have greater risk than governments. Talking of risk even different governments have different risks in the same way as corporates have risk that can be compared using their CDS rates.
Government bonds
Most bonds however are issued by governments in specific Maturities with at the short end 1-3 years, medium term 5 years and longer and long end 10 to 30 years. Different world governments have names for their sovereign debt they issue. In the UK this is Gilts, in Japan it is JGB, Germany has Bunds and in the US it is Treasuries. However whatever they are called most debt by government is issued as either floating interest or fixed interest at different maturities across the curve. This allows us to look at the yield curve as a whole across the entire tenor range. The tenor range here is the time period from now to 30 years out. We will look into Yield curves a bit later once we cover more ground work.
Fixed C, Float C against Fed Funds, Libor, etc.
We mentioned that we can have not only fixed rate coupons but also floating rate coupons, but you may be asking fixed against what ? Most variable or floating instruments are fixed against Libor, Euribor or the Fed Funds rate or other known daily fixings. The calculations are pretty much the same but you don’t know what the future fixings will be so this is an extra risk that must be accounted for during valuation.
Strips / Bullet
We talked about a bond having a Coupon and then having a Principal. Now let us suppose you only wanted just the Coupon without the principal. Or supposed you wanted just the Principal without all the Coupons. Well it is simple to strip a bond into just its Coupons and just its Principal. The two together make a bond, but the Coupons on their own create a floating or fixed rate income stream or STRIPS ( Separate Trading of Registered Interest and Principal of Securities ) and the Principal alone will create a Bullet or Zero Coupon Bond usually referred to as a Zero.
Given that we can now strip different bonds at different maturities into a series of Zeros at different Maturities we can see what the market thinks are the Returns of money at different Maturities.
FRA
FRA’s or Forward Rate Agreements are instruments where both parties agree a rate that will be applied at a future point in time. Party A will provide Principal at the beginning and party B will pay back the Principal at the Maturity plus the agreed interest rate when the agreement was entered into.
Floating Rate Notes FRN
These are bonds that typically pay Coupons Quarterly and have Coupons floating against a fixing rate like LIBOR or Fed Funds. A FRN will also have on it a spread this is called Margin which is fixed at a number of basis points. Each quarter the Coupon is calculated on the fixing date. On this date the fixing is taken from the LIBOR Fed Funds or whatever we are fixing against and the Margin in Basis Points is then added to create the value of the Coupon.
Basis Points
Basis points are represented as 100th of a percentage point if we had 5% we would have 500 basis points. Basis points are commonly written as +50 bp. So Libor + 50 bp, where Libor is 5% is 5.5%. Basis points are also called bips.
To take this out further we could have an FRN of Libor +50 so we pay the margin is 50 on this. If you have a variable rate mortgage you can see what the basis is as you would pay the fixing say the Bank Of England Interest rate ( related but different to Libor ) + x bips. The x is really the profit/risk the bank is making selling you the Mortgage and represents their relative view of your risk in not paying it back. So the higher the x the higher the risk you represent to the bank.
It is worth mentioning something called the risk free rate here. While everything has risk we say risk free rate because it is the interest you would get in the UK if you as a bank deposited money at the Bank of England. Risk free in theory as there is a very low default probability on a sovereign bank having a default. All central banks including the Bank Of England, Federal Reserve in the US operate a rate for bank deposits. This is the rate generally used for Mortgages and is the Interest Rate most non financial people know. The risk free though is not that risk free because all Sovereign ( Ie a Country US / UK etc ) have CDS rates representing their relative risk to each other. These CDS or Credit Default Swap rate is very low for G7 countries but get larger for countries that have larger debts or other issues. Compare Italy and Greece CDS rates against that of Germany and UK for example.
Repos
Repos are a form Borrowing or Lending. A repo is essentially a type of Sale and Repurchase agreement. So lets take 2 counter-parties A and B. A sells a specified Security usually a Bond to B and at the same time agrees to repurchase it back at a price agreed now. B will pay A some money for the Security and agree a date to return the Security for a price specified at inception.
This implies A is Borrowing or receiving money from B using the Security as Collateral. This is a way of short term financing but is quite an expensive way to finance things in the long run. When Lehman Brothers was having cashflow issue before it went into Default it was financing itself heavily in the Repo market.
Reverse Repo
This is a way of lending money, here A would buy the Security from B giving B some money and agree a price and date now for when they would sell the security back to B. This means A is lending to B using Security as collateral in the event of Default.
Swaps
A swap is an agreement to swap cashflows, and is a type of derivative. If you have a series of Fixed cashflows but you want to take advantage of Interest rate changes you can enter into a swap. What would happen is that a deal would be structured such that you would get a floating instrument stream in return for your fixed stream. A swap has an Inception where the dates that we swap fixed to float called fixing dates, the length of this swap how may years we do this swap and a value. At inception the deal is structured so that the net of Fixed and Float against the two counter-parties is 0 so fixed - float = 0.The deal will also contain a Notional amount so you would be swapping say 1M USD 5% against Fed Funds + X bp. The X is used at inception so the that they two cashflows net to 0. No notional is ever swapped.
On each subsequent fixing date you would get difference of 5% of 1M and Fed Funds + X bp. Since the Fed Funds is not static you would pay or receive the difference. Agin no notional is ever swapped. Note as no notional ever gets swapped this is effectively leveraged and thus a derivative.
Yield Ratio
What is the yield of a bond. Simply put it is the Annualized Coupon / Price of the Bond. This gives us the yield fraction. This implies that as the Price goes up the denominator gets larger and the yield goes down. As the price goes down the Yield goes up. So we know that yield and Price are inverse if one goes up the other goes down and vice a versa. This is the known as the Current Yield or Yield Ratio.
Yield Curve
If you look at a class of instrument say US Treasury Securities you will see they have different expiries which we will call Tenors and represents the Y axis in an XY graph. If you then look at each instrument and calculate its yield and plot those yields on the X basis against the Tenor / Maturity for that instrument on the Y axis you get a yield curve.
Given the curve is a set of yields at different tenors and that the Price of a debt instrument is impacted by the interest rate and Inflation we can say that the curve represents the markets future expectation of interest rates and implied inflation. Recall that rates are used as a Central Bank tool to dampen down inflation.
When building a curve you may not have all the instruments you need at the various Tenors to be able to create a curve. In this case you can bootstrap a curve using the implied rate of Zero bonds and debt instruments of the same type at the short end and swaps at the Medium and longer ends.
YTM and IRR
Yield to Maturity or IRR Internal rate of Return is the effective rate of return on each cashflow such that the sum of the net Present value NPV of each cashflow is the same as the bond PV. Assuming reinvestment of Coupon over the time period. You need Excel Solver or use a guesstimating tactic to get to the IRR.
Lets take a bond paying semi annually a .03 principal of 1 over 5 years. The current price is .96
We would take each cashflow and do
C * e ^ -y(T-t)
Where C = Coupon
e is the exponential ie =exp(…) in excel
-y is the IRR we are seeking but we don’t know right now
T is the Maturity
t is the current time period
Given we don’t know the IRR we would need to use Solver or similar in Excel to arrive at the y variable.

this then implies that C * e ^ -y(T-t) =EXP(-1*(IRR*t))*C
for t=.05 this is =EXP(-1*(.068406*.5))*.03
Note the calculation for year 5 is the calc for the C plus the calc for the P both Coupon and Principal are part of the last cash flow.
Once these are all summed up you get the total which is the same as the bond PV of .96.
Coupon Bond Valuation
Calculating the value of a coupon bond factors in the annual or semi-annual coupon payment and the par value of the bond.
The present value of expected cash flows is added to the present value of the face value of the bond as seen in the following formula:
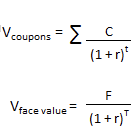
Where C = future cash flows, that is, coupon payments
r = discount rate, that is, yield to maturity
F = face value of bond
t = number of periods
T = time to maturity
For example, let’s find the value of a corporate bond with annual interest rate of 5%, making semi-annual interest payments for 2 years, after which the bond matures and the principal must be repaid. Assume a YTM of 3%.
F = $1000 for corporate bond
Coupon rate Annual = 5%, therefore, Coupon rate Semi-Annual = 5%/2 = 2.5%
C = 2.5% x $1000 = $25 per period
t = 2 years x 2 = 4 periods for semi-annual coupon payments
T = 4 periods
Present value of semi-annual payments = 25/(1.03)^1 + 25/(1.03)^2 + 25/(1.03)^3 + 25/(1.03)^4
= 24.27 + 23.56 + 22.88 + 22.21
= 92.93
Present value of face value = 1000/(1.03)4
= 888.49
Therefore, value of bond = $92.93 + $888.49 = $981.42
Zero-Coupon Bond Valuation
A zero-coupon bond makes no annual or semi-annual coupon payments for the duration of the bond. Instead, it is sold at a deep discount to par when issued. The difference between the purchase price and par value is the investor’s interest earned on the bond. To calculate the value of a zero-coupon, we only need to find the present value of the face value.
Following our example above, if the bond paid no coupons to investors, its value will simply be:
$1000/(1.03)4 = $888.49
Under both calculations, a coupon paying bond is more valuable than a zero-coupon bond.
Duration ( measured in Years )
This is a measure of how many years it will take for an investor to be repaid the bonds price by the bonds total cash flows. Think of this as a see saw where we have all the Coupons and a the big Principal at the far end. Where does the fulcrum need to be so the see saw is balanced.
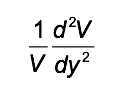
Macauly Duration ( Sensitivity )
The Macauly Duration sometimes called modified duration is a derivative representing the sensitivity of the Price with respect to the yield. If the yield curve jumps by 100 bp what is the percentage affect on the price, That is what Macauly Duration seeks to answer.

Notice the dV/dy as its the first Derivative of V on function y or Value V on the yield curve y. You can see these as discrete numbers when looking at the risk of a bond and is usually expressed as BP01 or DV01 meaning this is the dollar change of your bond given a 100 basis or 1% move in the curve.
The Macauly duration is sometimes also referred to as the time weighted average as it uses the IRR formula I showed you above. You can solve this by asking what Zero coupon bond has the same yield and then taking the derivative. For those keen I refer you to any of Paul Wilmott’s books on Fixed Income or Wikipedia which has a fully worked out example.
Note that this is Linear and represents the first derivative or slope of the change of the bond to the yield.
Convexity
Convexity is the second derivative of the sensitivity of the price to the yield. The yield may have a large curvature and the more curved the line the less accurate the slope or duration will be. The Second derivative is derived by doing a Taylor Expansion on the First Derivative and is
The assumptions here are that interest rates are constant over the life of the bond and that they occur evenly. Hence this will need regular recalculation. This measure shows the sensitivity of the duration. For worked examples see wikipedia but you would need to calculate the PV the duration and then use that to calculate the Convexity.
Bootstrap a Forward curve
The Yield Curve is basically a plot of the yield to maturity against the time to maturity for the same class of bonds. You can do a quick search for US Treasury yield curves and you will see a daily reference curve is published every day by the Federal Reserve in the US.
However you may realise at this point what I referred to earlier that you may not have all the bonds you need to actually create a yield curve so what happens is we create a curve that gives us the forward rates. The forward rates are interest rates that are assumed to apply over given periods of time in the future.
In a perfect world to build the forward curve you would assume you have lots of zero coupon bonds that you can use at different Maturities. You take all these Zeros and order them in Maturity Order. This means we know have a rough idea of what money is worth between now and the Maturity of each Zero. What we really want is the Rate between one Zero and the next Zero or one Maturity and the next Maturity. Given the first Maturity Z1 you can get the implied rate using:
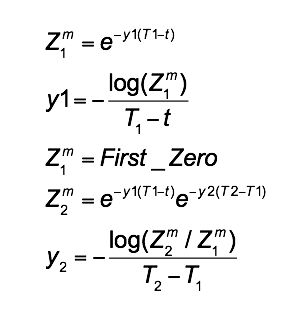
Now you have the forward rate from Z1 you can deduce the forwards rate between the end of Z1 and Z2.
This will give you a set of rates between periods. Now to join the dots you can do this linearly or you could actually do this using a Cubic Spline as the US Treasury does.
https://www.treasury.gov/resource-center/data-chart-center/interest-rates/Pages/TextView.aspx?data=yield
Now what happens in practice given we wont have Zeros at the short end or the very long end is we would use the rates from Deposit Rates from the Short End ( 0-2 Years ) then Zeros/bonds/FRA’s in the medium (2-10 years) part of the curve and Swaps for the longer end 10 years +. The link above has an explanation of the instruments used for the yield curve of US treasuries.
Interest Rate models
It should be plain to see that the interest rate is not a static rate but a rate that is constantly moving. So the question then becomes how do we try to model such a rate. There are lots of Stochastic Differential models out there that try to help predict the rate and they are all fairly complicated. To give you a flavour I am only going to talk about one of these mean reversion models CIR Cox Ingersoll Ross.
Cox Ingersoll Ross CIR
Unlike equities which are simpler to value Interest rates have a mean reversion term because rates tend to stay in a reasonably well defined bound. For example an Equity or Stock can grow in value and can drop in value by quite significant amounts, however an interest rate tends to stay in a narrow range, when interest rates go up or down they tend not to go change by more that a few bips from their last position meaning they move more slowly and tend not to spike as dramatically as equities.
Most of these models follow a drift + Random Weiner process like equities for Rate it is

You can read this as dr or Change in Rate = Drift over time + random Vol.
The CIR is
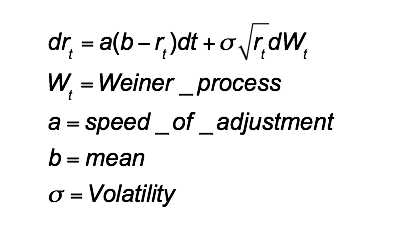
The sigma square root avoids negative rates for all positive a and b. You will see there is mean reversion around the mean here, and that the Weiner process is allowing for the randomness.
Optionality of Bonds
In order to complete our discussion on Bond Basics I want to talk about Optionality if Bonds. You should be aware that you can have a put or a call on a Bond which are OTC or Over the Counter contracts, but you can also use a Bond to protect yourself from interest rates. For example if you wanted to be sure interest Rates remained in a specific range and hedges yourself agains low rates and high rates you would firstly buy the Bond and then create a floor on each Coupon ie each coupon has a long put at the Strike you are hedging, and each Coupon would also have a short Call at the Strike you are hedging called the Cap. This way you are protected from rates that go above the CAP and that drop below the floor. This is called a collar.
In Summary you would do the following
- Buy the bond
- Buy a put option on each Coupon called the floor.
- Sell a call option for each Coupon called the CAP
Underlying - Risk_reversal = Collar
Now you could of course do it the other way round and sell the put and buy a call if you think there will be a large amount of movement in the rate and you want to profit from it.
When I talked about buying an option at each collar each of those options are called Caplets and floor-lets.
In order to value something like this you would need to value each caplet or floor let individually and use some form of Rates model like CIR to evolve the rates to predict where they will be at each caplet and floor let. This would then have to be done using lots of Simulations in a Monte Carlo type framework. Whilst I have done this before the explanation is well beyond the scope of a basic introduction to Rates.
People who enjoyed this article also enjoyed the following:
Naive Bayes classification AI algorithm
K-Means Clustering AI algorithm
Equity Derivatives tutorial
Fixed Income tutorial
Monte Carlo Explained
And the following Trails:
C++Java
python
Scala
Investment Banking tutorials
HOME
